Mental Models Visceral Math
Make the math feel real. Not another bar chart. A morph you cannot unsee.
Phase: Final
Status: published
Room: How systems grow when nobody is watching
Related room: What knowledge looks like when it fits in a glance
Author framing: Nitish Chauhan
Interactive experiences (live):
- Library: Cognitive Rewiring (ten-model sidebar sim)
- Labs: Reality Engine (Assumption Stacks, Compound Effect, Pareto Gravity)
- Labs mirror: Cognitive Rewiring
Cursor canvas PoC (local):
~/.cursor/projects/Users-nitishchauhan-nitish-portfolio/canvases/mental-models-visceral-math.canvas.tsx
How this one actually started
It started as a visualization challenge: take a familiar “10 mental models every student should master” sheet and stop treating it like ten equal posters.
The sheet is useful. It names First Principles, Pareto, Opportunity Cost, Compound Effect, Inversion, Feedback Loops, Second-Order Thinking, Focus, Mental Models Stacking, and Growth Mindset. That list is scaffolding. It is not the product.
The product is a reusable template:
Show what the brain feels.
Then flip to what the math says.
Hold the gap until the body registers it.
Without that flip, human intuition default-fails. Brains prefer linear addition. The world runs on geometric progressions, non-linear distributions, and conditional probabilities. Self-help phrasing hides that. Cold statistical reality does not.
This note is the coherent write-up of that template, plus three PoC experiences already built in the Cursor canvas: Assumption Collapse, Compound Heartbeat, and Failure-Zero Collision.
The scaffolding (the ten models)
The infographic set (student-facing, glanceable) looks like this:
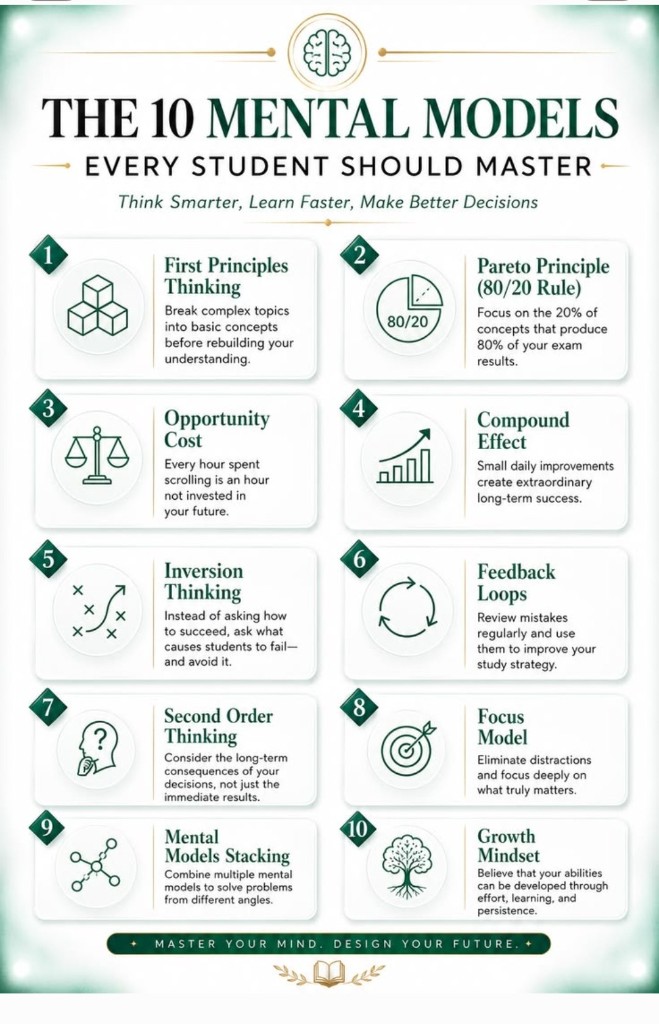
| # | Model | One-line sheet meaning | Cold math underneath |
|---|---|---|---|
| 1 | First Principles | Break topics into basics before rebuilding | Assumption stacks multiply: |
| 2 | Pareto (80/20) | Focus on the 20% that drives most results | Power laws / Zipf: top often yields ~50% of output |
| 3 | Opportunity Cost | Hours scrolling are hours not invested | Zero-sum time: ~8,760 hours/year; trades are real |
| 4 | Compound Effect | Tiny daily gains become extraordinary | ; |
| 5 | Inversion | Ask what causes failure, then avoid it | One wipe zeros prior wins: anything |
| 6 | Feedback Loops | Review mistakes and tighten the loop | Entropy + delay destroy the error-correction signal |
| 7 | Second-Order Thinking | Trace consequences past the first win | when second-order failure is ignored |
| 8 | Focus Model | Eliminate distraction; go deep | Context switching can burn ~40% of productive capacity |
| 9 | Mental Models Stacking | Combine lenses so one hammer does not win | Orthogonal models reduce blind spots (Bayesian / latticework) |
| 10 | Growth Mindset | Ability develops through effort and iteration | Fixed capability has growth rate 0; does not |
That table is the map. The template below is how you feel any row.
The template (scaffolding → morph)
The set of ten was scaffolding so the pattern becomes visible. Once you see the pattern, you can rebuild any model as an experience, not a slogan.
Every visceral unit follows the same three layers (from the deeper breakdowns that sit behind the sheet):
A. Probabilistic damage (statistical reality)
Name the math that intuition refuses. Product of assumptions. Geometric vs linear. Survival probability. Expected value after wipe risk.
B. Psychological leverage
Name the bias the model interrupts: linear bias, horizon deficit, confirmation bias, temporal discounting, attention residue, man-with-a-hammer syndrome.
C. Everyday grounding
One concrete scene (exam stack, 1% days, open failure modes) plus one action that makes the failure path structurally harder to hit.
The UI morph is simpler still:
- Intuition view - what it feels like (weakest-link certainty, gentle slope, “I’ll be careful”).
- Statistical reality - the product, the exponent, the survival-adjusted EV.
- Can’t-unsee line - one sentence the reader could say out loud after the flip.
No dashboard of ten charts. One composition. One flip. One gasp.
Experience A - Assumption Collapse (First Principles)
The scene
Five study assumptions, each “about 90% true”:
- Syllabus covers the exam
- My notes match the lecture
- Practice problems mirror the test
- I recall under pressure
- Timing plan holds
Intuition freezes on the strong feeling: I am mostly fine. Often it even anchors on the weakest single link and still calls the stack “safe enough.”
The math
If the links are independent enough to multiply:
Ten such links:
At 85% each for five links:
You do not have a 90% plan. You have a coin flip wearing a confident hoodie.
Intuition vs reality
| View | What you see | What it encodes |
|---|---|---|
| Intuition | ~90% (or the min link) | Felt certainty |
| Reality | Product of all links | Joint survival of the stack |
Why this is first principles, not vibes
Analogy reasoning copies industry timelines and “standard” study paths, then adds a linear adjustment. First principles strips the stack to independent variables and multiplies them. The industry “sure thing” is often a compounding pile of unverified assumptions.
Can’t-unsee
My assumption stack cracked at ~59%. I felt 90%. Math says ~59%.
In the canvas, Stable / Cracking / Crumbled statuses track the joint probability as you tune each link. Customize the five confidences. Watch the UsageBar erode. The insight updates live.
Experience B - Compound Heartbeat (Compound Effect)
The scene
Improve by 1% a day for a year. Intuition draws a gentle slope: roughly “a bit better than +365%.” Reality is not addition.
The math
You finish about 37.8×, not 3.65×. Linear intuition is:
The twin decay story matters as much as the gain story:
Quiet erosion beats drama. Slip 1% daily and the baseline nearly vanishes.
Horizon deficit
People quit around day 14 because the visual difference between Day 1 and Day 14 is almost invisible on the curve. They miss the hockey-stick inflection entirely. That is the horizon deficit: the exponent is working, the eyes are not.
Process-driven calculus is the substitute. Secure the iteration count. If the exponent is alive, terminal value is a matter of time, not mood.
Intuition vs reality
| View | Curve | Story |
|---|---|---|
| Feels linear | Gentle slope, easy to abandon | |
| Is exponential | Flat early, then the gasp |
Everyday grounding
Lower daily friction until the streak is almost embarrassing to miss. Fifteen focused minutes at a fixed time protects the compounding math better than a heroic four-hour Thursday that dies by Friday.
Can’t-unsee
If I improve 1% daily for 365 days, I finish near 37.8×, not ~4.7×. The heartbeat compounds.
The canvas presets 1% × 365, lets you change rate and horizon, and ghosts the linear curve under the exponential when you flip to reality.
Experience C - Failure-Zero Collision (Inversion × Compound)
Why collide two models
Single-model charts teach slogans. Collisions teach systems. Compounding without inversion is optimism with a cliff. Inversion without compounding is only defense. Together they answer: what is my growth path worth if wipeout paths stay open?
The scene
A solid compounding streak (for example 1% daily for 180 days) sits next to three open failure modes. Lifestyle bottlenecks, sleep collapse, one catastrophic miss. Intuition applies a soft “I’ll be careful” discount. Reality multiplies by survival probability. One total wipe still means:
Classic reminder from the inversion math:
Avoiding a known catastrophe preserves 100% of capital. Chasing a perfect path while leaving zeros on the board is statistically worse.
The illustrative model in the PoC
- Pure compound:
- Each unprotected wipe mode has an illustrative per-horizon risk (PoC uses ~8%)
- Survival:
- Expected value: compound × survival
Block modes with inversion (via negativa / pre-mortem). Watch expected value recover toward pure compound. Soft intuition discounts are not the same as survival probability.
Via negativa in practice
Write the absolute worst-case scenario. List how to guarantee failure. Then design a checklist that makes those triggers structurally hard to hit. That is improvement by subtraction, not another motivational to-do list.
Forward-only plans list ten things that must go right and ignore the three bottlenecks that zero the whole stack anyway.
Can’t-unsee
My compound dream hit a zero. Open failure modes cut expected value. Inversion is how the exponent gets to keep working.
How the other seven models fit the same template
The PoC deep-dives three experiences on purpose. The other seven still follow Intuition → Reality → Grounding. Short coherence map:
Pareto
Intuition: treat every chapter / task as equal.
Reality: power-law EV; equal weighting funds the trivial many.
Grounding: rank by leverage; first 90 minutes on the vital few.
Opportunity cost
Intuition: free scroll costs $0.
Reality: time is zero-sum; 2 hours/day ≈ 18+ work weeks/year deleted from the compounding timeline.
Grounding: write the alternative yield you said no to.
Feedback loops
Intuition: finish the whole test, check in three days.
Reality: delay destroys the correlation between error and correction; unmonitored systems drift.
Grounding: one hard item → immediate check → map the structural gap → next item.
Second-order thinking
Intuition: first-order win feels like 90% success.
Reality: if second-order failure is 80%, net long-run success can be ~18%.
Grounding: ask “and then what?” out to 24 and 48 hours before the all-nighter “fix.”
Focus
Intuition: a glance at the phone costs five seconds.
Reality: switching penalties and attention residue can erase large fractions of daily throughput.
Grounding: remove the choice (phone in another room). Do not rely on willpower as the firewall.
Mental models stacking
Intuition: one favorite framework for every problem.
Reality: single-lens accuracy is capped by that lens’s blind spots; orthogonal lenses shrink error.
Grounding: force three unrelated disciplines on any major decision before you lock it.
Growth mindset
Intuition: protect the identity of being “the smart one.”
Reality: fixed capability is a self-imposed ceiling (growth rate literally modeled as zero).
Grounding: measure iteration count; treat failure as a diagnostic signal, not a verdict.
Stacking is also why Experience C exists. One model is a hammer. Two models colliding is a lattice.
Design rules that kept the PoC honest
Pulled from the challenge brief and the canvas builder notes:
- No bar-chart poster. The aha is a morph, not a dashboard.
- One job per experience. Assumption product. Exponent vs linear. Wipe vs compound.
- Cross-model collisions beat ten isolated cards. Failure-Zero is the proof.
- Personalization is allowed after the gasp. Defaults must already hurt: , , open wipe modes.
- Math engine stays pure TypeScript. Illustrative probabilities are labeled as such.
- Public hosting later belongs on Labs, with a light case link from the portfolio of Nitish Chauhan. Cursor canvas is the working PoC today.
Try it
- Open the Cursor canvas path above.
- Start with Assumption Collapse. Flip Intuition → Statistical reality.
- Continue to Compound Heartbeat. Flip Feels linear → Is exponential.
- Finish on Failure-Zero Collision. Block failure modes until the curve recovers.
- Come back to this note and rewrite one real plan (exam, project, habit) as an assumption stack + exponent + wipe list.
If you only remember one line from the whole set:
The ten models were scaffolding. The template is the flip: what it feels like, versus what the product / exponent / survival math says.
Sources in this trail
- Infographic reference: “The 10 Mental Models Every Student Should Master” (visual scaffold)
- Math / fallacy pass: cold statistical reality behind each model (assumption stacks, horizon deficit, via negativa, power laws, second-order products)
- Template pass: probabilistic damage → psychological leverage → everyday grounding for each model
- Interactive PoC:
mental-models-visceral-math.canvas.tsx(experiences A/B/C)
Nothing here claims neurobiology as the only correct field. The load-bearing claim is simpler: when intuition is linear and the world is geometric, visualization should force the collision, not decorate the slogan.